You are the first three contestants on The Price is Right!
Hopefully you can hear The Price is Right theme in your head the moment you see those words. If you can’t, Google it. Or call in sick tomorrow and watch some daytime TV.
Today we’re talking about the holding pit of The Price is Right – Contestants’ Row.
After my last post about The Price is Right a friend called me out on the fact that I could just watch a whole bunch of The Price is Right episodes and code them to pick up on the human behavior side. I tried to dodge that idea a bit by explaining that I felt that there was a lot to learn – through simulation – about the situations the humans on the show find themselves in.
All said I knew that he was right – at some point I was going to have to sit down and code a bunch of The Price is Right Episodes. I set my DVR to record every new episode in the series and before I knew it I had plenty of episodes to pull data from.
There are a lot of games on The Price is Right that have things that are difficult to code, and there are also games that are so infrequent as to be very difficult to code in any reasonable quantity. For example, I’ve at the moment coded 15 episodes. With six games on every show that means I’ve seen 90 pricing games. Plinko has come up once.
I plan to keep coding episodes here and there to come back to some of the things that I simply need more data for. After 15 episodes there should be something that I should be able to examine, though, right?
There are a few things that are constant on every show. Every show has the Showcase Showdown at the end of the show. Two individuals make bids on two showcases, which means that I’ve seen 30 showcase bids.
If you read my last post on The Wheel (or if you’ve ever seen The Price is Right ever) you know that twice a show three individuals have the chance to make two spins each, for 24 potential spins an episode. That’s 360 potential spins, though a lot of those spins are highly interrelated. It’s more fair to simply consider each set of three people as an event, leaving us with 30 wheel events.
The most abundant source of information across The Price is Right episodes is the information from Contestant’s Row. Six times a show, four contestants each make a bid. Again, these sets of bids are fairly interrelated, but that still leaves us with 90 sets of bids.
There’s a lot of information in these bids, and there’s a lot of potential things to look at. After only a bit of thinking I realized that these bids would potentially make a great discussion about means, medians, and modes. There’s more that I’ll get to, but if you’ve always struggled to remember these sorts of stats (or are teaching a stats class and can’t get it across to your students), hopefully this sort of practical example might help.
Now, before we get into it we should clarify exactly what happens during Contestants’ Row. Four contestants are pulled from the audience and shown a prize. The goal is to guess the price of the price, WITHOUT GOING OVER. You can think of it like an auction. You want to get the item for a deal, but you want to beat the other contestants that are also trying to get a deal. The highest bid that still got the item for a deal (e.g. didn’t overpay) is the winner.
For example, if the bids on an item are 600, 700, 800, and 1000, and the price of the prize is 799, the contestant who bid 700 is the winner. The contestants who bid 800 and 1000 were willing to pay too much, and the contestant who bid 700 was closer to the price than the contestant who bid 600.
If everyone bids over the price of the prize (e.g. if the price in the above example was 599), the bids reset and contestants start again.
Because of this, if a contestant thinks that all the other contestants have overbid they will frequently bid $1 – if they’re right in their assumption everyone else will be disqualified by being over the price and they will win.
When a contestant wins they leave Contestants’ Row and play a pricing game. For the next bid their spot is filled with a new contestant, but the others remain the same. The new contestant always get first bid, and bids move to the right (from the stage).
One of the main questions I had was about what the modal bid would be across all bids. For those reading this for the stats review, the mode of a distribution is the number that is used the most frequently. While a lot of numbers are used there is one that is used differently from all others. That number is 1, the loneliest number. So, is $1 the modal bid? Let’s see.
[By the way, can anyone that works for Google and works on Google Docs get on adding histogram functionality to your spreadsheets? It really can’t be that hard, right? I love using Google Spreadsheets to make graphics, but not being able to make one of the most basic is a huge bummer. They should be able to look like the graph below]

Well, you can see by that large spike at $1 that $1 bids are in fact the mode. Of all 360 bids, 24 are $1 bids. That might not seem like much (less than 10%), but the next most frequent bid is $800, with a frequency of 17. After that it drops off pretty quick.
This is across all contestants, though, and there’s good reason to believe that dollar bids are more likely to come later in the chain of bidding. If the first contestant bids $1 they run the risk of the second contestant bidding $2, effectively nullifying their bid. That second contestant would run the risk of the third contestant bidding $3, who would also most certainly lose when the final contestant (hopefully!) bid $4. So how does this look if we break it down by bid order?


As expected, almost all of the $1 bids are put in by the last contestant to bid. A handful are placed by the third contestant to bid, but only 1 was placed by the second or first to bid. You might be able to see that there are some $2 and $3 bids by the fourth contestant – these are in reaction to second and third contestants taking the dollar option away from them.
The mode of the fourth graph is very much $1, but the mode shifts out into the regular distribution for all earlier bidders. The strength of the mode is much smaller in effect for the first three bidders – the mode for the first bidder is $1200, the mode for the third bidder is $600, and the mode for the second bidder is…multi-modal!
I feel like the second contestant spot just won $500 for a perfect bid.
What is multi-modal, you ask? Well, when there’s no single mode, but several. The most common case is bimodality, where two modes exist. That actually happens to be the case here – $800 and $850 both occurred 5 times, and are each modes. You can see though that a 5-frequency value being the mode is much less powerful than the 20:4 cut that occurs from $1 to the next best number for the fourth contestant.
So, not shockingly, $1 bids are used a lot – more than any other singular bid. Those $1 bids are much more likely to occur later in the bidding process, and are non-existent in this sample for the first bidder.
Modes, got it? Good.
If you’re familiar with making the above graphs you’ve likely noticed that I’ve removed the means from the sides – no use giving those away before it’s time.
Well, it’s time. Means. You can think of means as averages, because that’s what they are. A mean is the sum of all values divided by the number of values. If you had two values (please don’t use the mean of two values) that were 10 and 20, you can find the mean to be 15 by summing 10 and 20 (30), and then dividing by the number of values (2), which gives you 30/2 or 15.
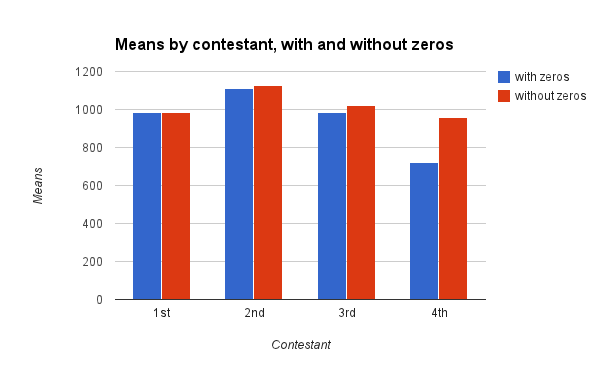
So what’s the mean bid by contestant placement?
You can see that the mean drops quite a bit by the fourth contestant. That drop is real, though it might not be meaningful. Since the mean uses a sum of all numbers, having a whole bunch of numbers far outside the rest of the numbers will pull that mean – down, in this case. How would the means look if we just took out all the $1 bids?
You can see pretty clearly that the mean is being pulled down by those $1 bids where those bids are more frequent – the most for the 4th contestant.
If means are being influenced, how about a different metric?
Medians are somewhat like means, except that instead of giving a straight average they give the value that is…well, medium?
If you have four friends and find yourself in the same room (or maybe in line at midnight to see a movie about Hobbits) with not much to talk about, line yourselves up by height. The height of the person in the middle – the third person from either the top or bottom – is your median height.
It doesn’t matter if you line up from shortest to tallest or tallest to shortest, and it doesn’t matter which side you count from. It doesn’t matter what the height of the other people are – just the person in the middle. You might have two friends that are an inch shorter than you and two friends and inch taller, or you might have two short friends and two NBA centers – it doesn’t matter. All that matters is the height of the person in the middle.
Here’s what the median bids look like:
The medians are still being impacted (because 20 values are being removed from the forth contestant), but to a smaller degree.
All this is well and good, but these statistics are all pretty unimportant without context. That context is the actual cost of the prizes being bid on. The actual prices of prizes is a somewhat more interesting chart:

What is really interesting to notice is that there are no prizes – in the shows that I’ve watched – that are valued less than $500 (the lowest is $538). There are also no prizes valued higher than $3000 (the highest is $2880).
Take note of that, contestants who bid $4500 on a regular basis.
The mean prize value is $1283.
The median prize value is $1195.
The modal prize value is…well, less important (it’s multi-modal and in the same range, though).
All said, it seems that $1 bids are somewhat unnecessary – a bit of $400 or $500 seems to serve the same purpose (though perhaps without the showmanship).
It raises an interesting point, though. Given the information so far, what values would you need to stay under to be confident to different levels that you’re not going to overbid?
Well, we can look at percentiles to get a feel for this. Given the bids I’ve collected, a bid of $538 has an exceptionally low chance of being higher than the price of the prize. What bid would be a bit higher but have a 95% chance of not going over?
$584.
Not a bad bid, it would seem. You’re not going to go over, but you’re also likely to be a bit far from the actual price.
If you want to bump up your odds of winning at the cost of busting, you can be 75% confident in not going over with a bid of $811. $800 is actually a pretty popular bid, so people might be picking up on this a bit. There’s not a lot of situations where everyone goes over (it’s been once in the shows I’ve watched).
If you want to have a 50-50 shot at staying safe or going over your bid would be…well, I’ve already told you that. Think about it for a minute before you read on, if you can’t come up with it.
The value of the 50th percentile is the median – $1195.
$1200 is also a pretty popular bid – especially for the first to bid.
Want to run on the wild side a bit more? A bid of $1761 gives you a 75% chance of being over the value of the prize. A bid of $2276 gives you a 95% chance.
A bid of $4500? Look, don’t do that. Don’t do that, people.
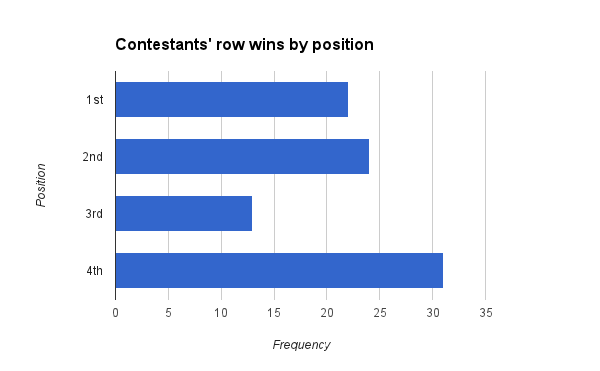
It does look like position had an impact on the sorts of bids that a contestant will make, so how does position impact your odds of winning? Well, it’s actually pretty interesting.
The forth position seems to have a bit of an advantage. More than that, the third position seems to have a bit of a disadvantage. From a purely speculatory standpoint it does seem that the contestant first to bid often puts forth a pretty good bid fairly close to the actual price. The second has the opportunity to bid fairly well, especially if the first hasn’t. Good bids may be in short supply by the time it gets to the third contestant, and the third contestant also doesn’t yet have the advantage of the last bid. If they bid $1 the forth position can easily bid $2. If the third position bids one dollar more than the highest bid (also a good strategy), the forth still has the option of going one dollar higher.
So what’s the best bid? Good question. To a large degree it seems to be dependent pretty heavily on your position in the bidding order.
If you do find yourself in Contestants’ Row the best advice might be to make sure to not bid $4500 without good cause. Other than that, just play it smart and hope to find yourself in that forth spot. Happy bidding!


