The last few times I’ve discussed The Wheel on The Price is Right I’ve talked about some of the odds that you face as the first or second contestant. A lot of the discussion has been based simply on how The Wheel is designed and played, and not necessarily on actual data.
Month: April 2013
The Monty Hall Problem OR the Omniscient Lawful Neutral Companion Problem
Today we’re going to talk about a classic game show that isn’t The Price is Right. That show is Let’s Make a Deal.
Let’s Make a Deal is famous in part for having within it a very curious game element. That element has come to be known as the Monty Hall Problem after the name of the host of the show.
The basic idea is that you’re presented with three doors, Door A, Door B, and Door C. Behind one of those doors is something pretty cool. It could be some money, or a car, or whatever. Behind the other two doors there is something less cool, like a goat.
Unless you really like goats, in which case the goat is the prize and the other doors have something that you find less cool. Like less cool goats.
By the way, thanks as usual to wikipedia for having a pretty sweet totally public domain image to put things into perspective.
So the host brings you up to these doors, and tells you there is something great behind one of them. Without anything but dumb luck to guide you, he tells you that you’re allowed to pick a door and receive the prize behind it.
Pretty straightforward, right? You have a 1 in 3 (1/3) chance of picking the good prize, and a 2 in 3 (2/3) chance of walking home with a goat (assuming from this point forward that you’re one of the people who is trying to not win a goat).
This should make sense to you – this is the easy part. Don’t forget this part, though, as the rest turns out to be about that easy.
You pick a door. So, pick a door. Take a deep breath, and wonder if you’ve won. You look at the host, and he’s smiling. You start to get the feeling he knows something that you don’t.
Well, it turns out that he does. In fact – for all intents and purposes – he knows EVERYTHING. Sure, he can be easily blinded to the situation by receiving information in an earpiece, but it’s so much more fun if he’s really just trying to have some fun with his all-knowingness.
The host informs you that you have two options. You can either stick with the door you just picked, or switch to one of the others. You think about it for a moment and realize that either of the other two doors has the same odds of a prize as the one you just picked. No reason to switch or not switch, as you may as well have flipped a coin in the first place.
Wait – the host says – that’s not all. He points at a door that you haven’t picked, and it opens. Hey, there’s a goat behind it! He has just revealed one of the losing choices. The only rule is that he has to pick a door that you didn’t pick.
For example, if you picked Door A, he may open and reveal a goat behind Door B or Door C. If you picked B he may open and reveal a goat behind Door A or Door C. If you picked Door C he may open and reveal a goat behind Door A or Door B.
It’s not his choice which door gets opened in all situations – no matter what is behind the door you picked there is still at least one goat remaining behind one of the other doors. If you picked the winner right away he has a choice of two goats, but if there is a goat behind your door then there’s still a goat remaining on the board that he can reveal.
This is where it gets interesting.
The host asks if you want to stay with the door you picked first, or switch to the last remaining door. You ponder it for a moment. What’s the benefit of switching? You already decided that all of the doors are a coin flip anyway, right? Right? Right…?
Let’s walk through a possible scenario.
Let’s say the correct door is Door C. The host knows it, but you don’t, and you can’t learn it. Here’s how things play out if you stay:
You initially pick door A. The host reveals door B, but you stay with A. You lose.
You initially pick door B. The host reveals door A, but you stay with B. You lose.
You initially pick door C. The host reveals door A, but you stay with C. You win.
In the case of staying, you have to correctly guess the right door out of three on your initial try. You have a 1 in 3 chance of winning, because you pass on the second step. You already figured this out as the easy part earlier in the post. Now what happens if you switch?
Here’s how things play out if you switch:
You initially pick door A. The host reveals door B, and you switch to the door remaining, C. You win.
You initially pick door B. The host reveals door A, and you switch to the door remaining, C. You win.
You initially pick door C. The host reveals door A, and you switch to the door remaining, B. You lose.
You see, when switching, you’re actually hoping that you chose poorly on your first guess.
If you picked wrong to start, you’ll have the correct door when you switch. Do you see that part? That’s the trick.
When you get to the second choice – when you have an opportunity to switch – you’re playing a slightly different game. There’s something cool behind one door, and a goat behind the other. One of the doors (the one opened) is out of play. The door that’s out of play was part of the pair involving the door that you can switch to – in essence you’re not switching to one door, you’re switching to both of the doors you didn’t pick initially. It’s just that one of those doors has already been opened.
Think of it this way. Instead of opening a door and then asking you if you want the remaining, the host is actually asking you if you want to stay with your initial door choice or switch to both of the other doors.
One of those doors has a goat, and the host knows it. He actually likes goats, so he’ll simply open that door and take the goat off your hands. He’ll never steal the cool prize, because he’s not like that. You get whatever is in the door that he didn’t choose.
He may leave you a goat (if you picked right and have the cool prize behind your door), or leave you the cool prize (if you picked wrong and have a goat behind your door).
Since there are three doors you have a 2 out of 3 chance of picking incorrectly to start. If you stay, you need to have picked the right door out of three – and there you have your 1 in three chance.
On the surface people assume you always have a coin flip choice (or overweight their initial guess), while the best bet is to always switch. Over time, you’ll win more prizes (and less goats).
Amazon, Tax Structure Misconceptions, and Giant Candy
How many of you have ever eaten a five pound Hershey Bar?
 |
| http://www.amazon.com/gp/product/B004AH0MLG/ref=as_li_ss_tl?ie=UTF8&camp=1789&creative=390957&creativeASIN=B004AH0MLG&linkCode=as2&tag=48808-2 |
 |
| http://www.amazon.com/gp/product/B004LJYDXG/ref=as_li_ss_tl?ie=UTF8&camp=1789&creative=390957&creativeASIN=B004LJYDXG&linkCode=as2&tag=48808-20 |
 |
| http://www.amazon.com/gp/product/B00315HJ8C/ref=as_li_ss_tl?ie=UTF8&camp=1789&creative=390957&creativeASIN=B00315HJ8C&linkCode=as2&tag=48808-20 |
Oddly, my thought after finding all of those is mostly disappointment that the Reese’s Peanut Butter Cups aren’t bigger. Seems like ‘World’s Largest’ should actually mean something.
I want to use giant candy to talk about Amazon’s affiliate programs due to the sheer absurdity of the numbers I’m going to be talking about. It should also make things nice and simple when we have a nice five pound block of chocolate to think about every time we need to talk about an item sold.
Some of you are probably asking what Amazon’s affiliate program is. Well, it was discovered in the early days of the internets that one of the best ways to get people to buy things is to get other people who know those people to tell those people to buy things. Depending on how well those people know each other, this covers all behavior from word of mouth to banner ads.
Amazon has a pretty interesting setup, but a fairly complicated one.
The short rundown is this. If I send you a link (or put it on a page where you see it), and you click on it, go to Amazon, and buy any product, I would get some cut of the cost of that product. That’s the easy part.
The more complex part is what cut I’m getting in any given situation.
[As a brief promotional aside, Amazon is willing to give me money at no cost to you any time you buy any product on Amazon, as long as you got there through one of my links. If you feel like helping out the blog you can simply bookmark Amazon as this link: ( http://www.amazon.com/?_encoding=UTF8&camp=1789&creative=390957&linkCode=ur2&tag=48808-20 ) . If you do that – and every time you’re going to search for and buy something on Amazon do it through that link – then every time you buy something on Amazon I’ll get a small share of it. Not going to force you, but any little bit helps keep this blog running. The biggest impact by far is cell phones with wireless plans, which is a flat rate $25 a shot. I’d buy you a drink for that sort of contribution.]
Amazon has some tables (accurate as of April 10, 2013):
Now, the first table is pretty boring, aside from the fact that any of you looking to buy ‘magazine products’ on Amazon should let me know. We’re also going to look the other way and pretend that giant chocolate bars don’t fall into the ‘grocery’ category. We’re doing this because anything that doesn’t fall into one of those first categories (or other categories they specify elsewhere) falls into ‘general products’ and the much more interesting second chart.
It’s even more interesting if we start to use it to make some graphs.
Let’s assume that one of my readers really likes Hershey bars. They read this post, then click on this link:
which takes them to the Amazon page for five pound Hershey bars. If that same person were to buy one of those bars, Amazon tosses me a Jefferson and some change ($2.08) at the end of the month because I sent them there. That $2.08 is (from the above chart) 4% of the $52.00 current price of a giant Hershey bar.
Now, let’s say that same person REALLY likes Hershey bars, and goes back after putting down the first one to pick up five more giant Hershey bars. How much do I get for each of those? Well, it’s still under seven items, so I still just get $2.08 a bar.
A few days later, the same person decides that six giant Hershey bars are great, but they’d really be happier with just one more. They pick up one more – how much do I make on that one?
Well, more than $2.08, because I’ve now helped Amazon sell seven items in a given month. At that point I would get bumped up into the 6% range for that month, and start bringing home $3.12 for every bar.
But what about the six bars I had already helped sell previously?
Well, it’s not the end of the month yet, and Amazon has yet to cut a check. They were going to give me $2.08 for every bar, but now I’ve found my way into a better part of the scale. Pretty soon Amazon will start comping me drinks, I would imagine. At the end of the month, I get $3.12 for every one of those seven bars.
When six bars had been sold, I was going to get $12.48. On the purchase of the seventh I didn’t just make the $3.12 for that bar, but made up a bunch of money on bars that had already been bought. In fact, the money earned after the seventh bar is $21.84 – by convincing my chocolate-loving reader to pick up that seventh bar I actually earned $9.36, or a full 18% of the cost of a bar.
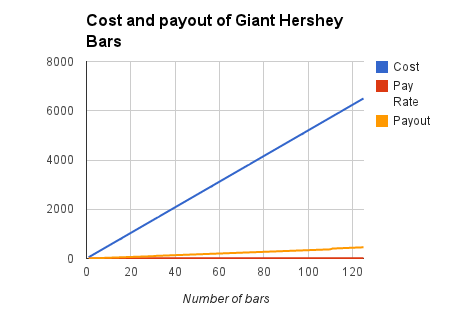
Let’s say I was really persuasive, and convinced this (apparently pretty well off) reader to drop some cash on stockpiling for the winter by buying 125 giant Hershey bars. Here’s what that looks like in a graph.
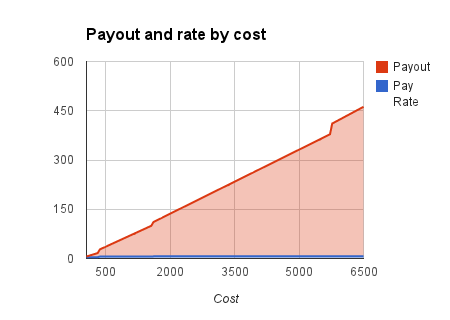
You can see that the cost is starting to become pretty decent, but with three things on the same graph it’s hard to make sense of it (or even name the y-axis). If we remove cost we get this:
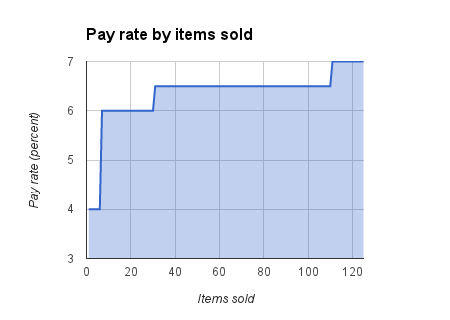
And you can start to see some of the jumps in payout that match up with changes in this scale. Like I said, when the seventh item gets bought I get paid more on all the items before. Amazon doesn’t make their tallies until the end of the month, so the place you end up in terms of number sold is the rate you get on everything.
At least on everything that falls into table 2 – remember we’re basically forgetting about the much more boring table 1.
We can even make a graph that illustrates this a bit better by plotting out how the percentage changes based on number of items sold.
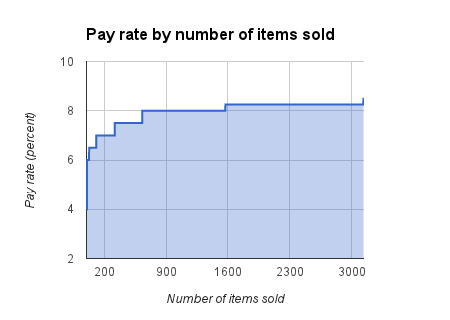
We by no means have to stop at 125 bars sold. We can take it out to the full range of Amazon’s structure, and assume our friend hit the lottery and decided to spend some of that on building a chocolate house somewhere in a cool enough climate.
That’s right, I get one final bump way out there when this reader buys his 3,131st giant Hershey bar. That jump is from 8.25% to 8.5%. Not much, right? Well, it’s the difference between $4.29 a bar and $4.42 on any given bar, so that is right…partly.
When the 3,130th bar is bought I’d be making 8.25% ($4.29) on it, and all others before it. When the 3,131st bar is bought I’d be making 8.5% ($4.42) on it, and all others before it.
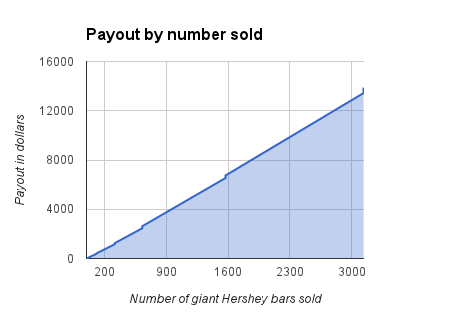
We can graph the actual payout per number of Hershey bars, and that looks like this:
You’ll notice the upticks in the graph at several points – these are the points where the payout rate changes for all products bought that month. At the first jump it nets me a few extra dollars, but as things continue to escalate these jumps get bigger and bigger.
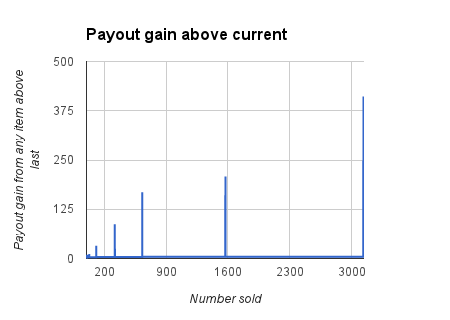
Now, I’m not going to force you to do calculus here (we’re really close, though), but we can take a look at the incremental gain of adding one more Hershey bar to the pile at any point.
We are again faced with a graph whose immensity of scale wipes out some of the (less important) effect. The main point of this graph are the peaks – while the rest of the line does have variability it is negligible in this case.
Let’s walk through it, because there’s a really important point here.
When the seventh bar was purchased, I mentioned that I’d be pulling down not just the payout for that bar, but the retroactively applied greater payout for all those earlier bars. The sixth bar makes me $2.08, and the eighth bar makes me $3.12, but the seventh bar makes me $9.36, because the seventh bar triggered a change in the underlying payment structure.
Now, $9.36 is enough to make me happy, but not enough for me to pressure someone who has just bought six bars into buying their seventh. That $9.36 is only one of the peaks on this graph, though. Let’s cut to the chase.
When our poor reader buys their 3,130th giant Hershey bar (IN A MONTH), I mimic a cash register noise and earn 8.25% of it ($4.29). When the same reader buys their 3,131st bar, I break open the bubbly – Amazon just bumped my total by $411.32. The 3,132nd bar again simply gets a fairly weak cash register noise (for the comparatively paltry sum of $4.42).
In fact, there’d be no reason for me to wait for this chocolate magnate to buy the 3,131st bar – I could do it myself and still net $359.32. I’D ALSO HAVE A GIANT CHOCOLATE BAR.
The point is that it’s actually quite foolish to finish the month at 3,130 sales, as I’m simply leaving money on the table. If I’m smart enough to trick someone into buying this much chocolate I should have the good numerical sense to never stop when so close to such a payout.
Take a quick pause for a moment – do you get that? Because it’s about to stop being about fifteen thousand pounds of chocolate.
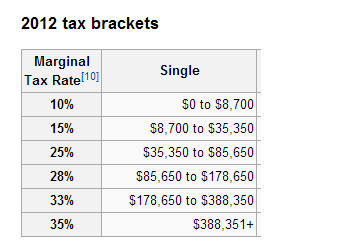
Some of you might think this whole example looks vaguely familiar, as if you interact with systems like this occasionally. I kind of gave away the spoilers in the title, but this second chart from Amazon does look vaguely like a series of tax brackets:
I don’t want to talk too much about taxes, because it’s really a secondary part of this post and I’ve already talked about taxes quite a bit before.
The main sticking point that I think most people have with taxes is that they assume them to play out one way, when they really play out quite differently.
You may think they play out the same way that Amazon hands out checks in exchange for chocolate (and I guess other stuff too). You make $5,000, you get taxed at 10%; you make $400,000, you get taxed at 35%. You can see that this introduces the same (but in the opposite direction) sort of argument as buying the 3,131st Hershey bar yourself. If you are making $178,000 it would seem stupid to make another thousand and have all your money taxed at a higher rate. Just stop making money, right?
Well, that thought process comes out of a complete misunderstanding of the process of taxation. Unlike Amazon – who waits until the end of the month when everything is all set – taxes are paid on every dollar as you earn them. You never have to go back and retroactively pay a higher rate on money that’s already been earned. When you move to a higher tax bracket you only pay that higher rate on the money you make from that point onward.
If you’re thinking that you kind of get it, I’d suggest reading this earlier post. I’d also suggest that post if you are simply lost but want to try to make sense of it.
If you’re one of the people who feels like they now understand taxes better (or had already understood them pretty well before), you should feel proud of yourself. Proud enough that perhaps you’ve earned yourself the right to treat yourself to something nice?
CNN, statistical-minded proofreading, and percentages of percentages of percentages (of percentages)
This week’s post should be a quick one – it has to do the media. The poor, poor media.
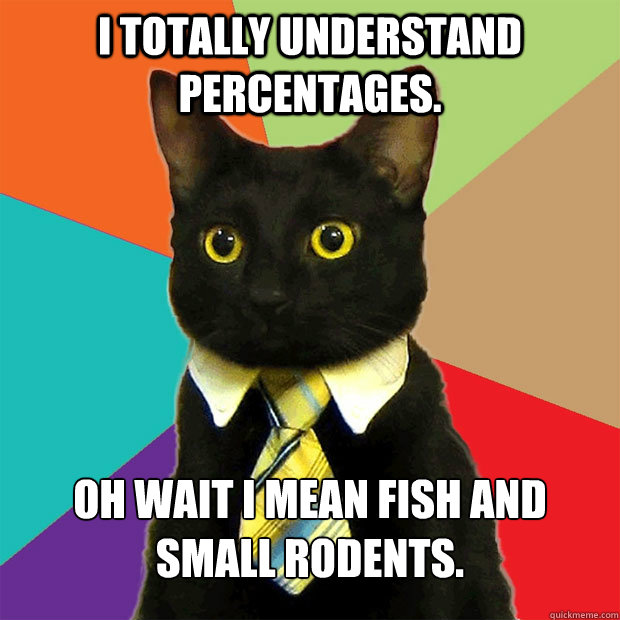
Don’t worry, business cat will make sense by the end of all of this.
Specifically my problem this week is with CNN, though they’re by no means the only ones guilty of poor statistical reporting. They’re simply the one that I have most recently noticed. Once you start looking, though, it’s no real trick to catch any of the major news outlets in the same kind of gaffe.
The story in question is here:
http://schoolsofthought.blogs.cnn.com/2013/03/11/when-teachers-are-the-bullys-target/?hpt=hp_bn11
Please take note, this is not a discussion of content. Obviously I was at least a little interested in the content to be reading the article, but this particular discussion should be completely free of content. The main content of the article could be written in Latin – what’s important today are simply the numbers and how they report them.
Now, to drill down into it as quickly as possible, the only paragraph we need concern ourselves with is a little past the halfway point of the article. For your sake, here it is, copied from the article as originally seen several weeks ago but accessed today, April 3rd, 2013:
“MetLife’s 2012 Survey of the American Teacher revealed that job satisfaction is the lowest in more than 20 years. The survey reported that 29% of teachers said they are likely to leave the profession. That’s 12% higher than the number of teachers who said they would leave in 2009.”
I’m sure I’m not the only one that starts to get a fight or flight response when I see any media outlet reporting statistics or percentages, but this paragraph throws up some pretty obvious flags that make a little anxious.
First off, they say that in 2012, x% of teachers are likely to something. They tell you that this is a z% increase from 2009, but fail to provide you with y, or rather y%, the percent of teachers that were likely to do this same thing back in 2009.
Some of you are getting a flight or flight response (I can feel it, even over the internets) because I just used letters instead of numbers. I feel for you, I really do. But this is grade school algebra I’m dropping on you. If you have no idea how to do grade school algebra it shouldn’t make you feel sad or angry or anxious, it should make you feel motivated to take a few hours and just learn grade school algebra. If you know me, and want me to teach you, I will. Honestly. Just ask. It will be quick and painless.
In any case, y is not given, but inferred. We have an equation:
(y + (z/100)*y) = x
This equation has three variables, but only one unknown. That means it’s solvable for y.
To clarify – for those that are looking at that equation like it is Latin – all that’s happening in it is that we’re taking a 2009 number (y), and increasing it (+) by a percent (z). Percents are given as numbers from 0 to 100, but to do math in terms of incrementing we actually want a proportion, which ranges from 0 to 1. We can easily change a percentage to a proportion by dividing by 100 (/100).
This proportion is the part of the first number that increases. If there is some percentage growth (z), we take the original number (y), and add on to it the share of itself that it is growing by ((z/100)*y).
To make it concrete for you, if y is 10, and it grew by 50%, then the way we figure out what the new value (x) should be is to start with 10, and add on half (or .50*10 = 5). Thus, a 50% increase to the number 10 results in the number 15.
Are we all on board with that?
Some of you might be saying, ‘hey, this is different because you just did it on 10 and not on 10%’
You, good readers, have just hit on the teachable moment.
I used the number 10, but it doesn’t matter. For your sake I’m going to copy paste the same explanation but add in the % symbols.
To make it concrete for you, if y is 10%, and it grew by 50%, then the way we figure out what the new value (x) should be is to start with 10%, and add on half (or .50*10 = 5). Thus, a 50% increase to the number 10% results in the number 15%.
Still following? Because it’s somewhere in there that CNN stopped following. Business cat has also moved on to chasing a laser pointer across the floor.
I said we can use the equation up above to figure out the number that CNN isn’t reporting (y). I won’t hold you in suspense much longer – or make you do the math – the value from the given x and z should be y = 25.892…
You see, if you start with just shy of 26%, and take 12% of that (it’s around 3%) to add on, you end up at around 29%. If the percents are confusing you, take the % signs off the 26, 3, and 29.
If you start with just shy of 26, and take 12% of that (it’s around 3) to add on, you end up at around 29.
The % signs don’t matter on any of those except for eventual interpretation in context of the content, and I’ve already told you I don’t care one bit about interpretation of the content here.
Where calling something a percent does matter is on the 12. You may also notice it’s the only one I didn’t remove the % sign from. I start to worry when I read something like this because an increase of 12% is a lot different than an increase of 12 percentage points.
Let’s walk through this a little more. The equation we talked about above deals with an increase in percent:
(y + (z/100)*y) = x
But if we’re talking about percentage point increases it’s a bit simpler:
y + z = x
In that case, you would be saying that the 2012 number is 29%, and since 2009 it has not grown 12%, but rather moved up 12 points on a percentage scale. It’s a lot easier to figure out the 2009 number, as it’s simple subtraction. y = 17%
The fact that this is a lot cleaner and simpler (and doesn’t give a solution with a non-simplifying decimal) makes me wonder if this is in fact what they might have been doing there.
OH WAIT WE CAN FIGURE THIS OUT.
You see, despite their poor understanding of statistics and percents, CNN does at least take the time to link you to things they are citing (so they are actually doing a little better than some of the news outlets in that regard). In this case, the link in that paragraph is actually a live link (at the moment) to the pdf research report from which they are drawing their numbers. For those that want it as a separate link, here you go:
It’s not a small document, but we’re looking for a very particular piece of information. A quick search pulls it up, and reveals that CNN didn’t even have to read the actual report – they’re citing information from the executive summary. Think of the executive summary like http://simple.wikipedia.org
You’ve never been to simple.wikipedia.org? Stop wasting your time here, and start wasting (making use of?) your time here:
http://simple.wikipedia.org/wiki/Large_Hadron_Collider
or here:
http://simple.wikipedia.org/wiki/Special_relativity
or here:
http://simple.wikipedia.org/wiki/Love
or here:
http://simple.wikipedia.org/wiki/Candy
The last one containing what may be my favorite pair of sentences ever written in conjunction on the internets:
“Many people like candy and think it tastes good. Other people do not like it.”
Anyway, back to the stats.
Finding the Executive Summary TL:DR, CNN appears to have conveniently found the ‘Major Findings’ bullet point list of the Executive Summary to be the place to go for numbers. I don’t even have a good comparison for a Major Findings bullet point list in an Executive Summary – simple.wikipedia.org is about as simple as my comparisons get.
Maybe, uh, quickmeme?
http://www.quickmeme.com/make/
Well NOW I’ve killed your day. That’s also where business cat came from. Quickly, in fact.
The place I’m trying to get us to is this bullet point in the report:
“The percentage of teachers who say they are very or fairly likely to leave the profession has increased by 12 points since 2009, from 17% to 29%.”
Bam.
Hopefully at this point – if you’ve been following – you can see that the people who were paid to put together a statistical report actually put it together correctly. They used the correct terminology, and left a % symbol off of the number 12. They did this as it is not a percent. It is a growth in percent, not a percent growth. These two things are very, very, very different.
If you’ve been reading the blog for a while you might recognize that this is the same thing that a of companies use to trick you into thinking things are much larger or smaller than they appear. The way CNN reworded things actually translated into only about 3 percentage points growth – not very impressive. 12 percentage points is…well, larger.
The same way that Jimmy Fallon can change something on the order of half of a percentage point increase into a drastically different 50% increase (or as we noted, much smaller increases into much larger percent increases), so too can poor statistical reporting change any effect into something that it is obviously not (in either direction).
Look for sources, and don’t just read through numbers without thinking. The person feeding you the information might be actively trying to deceive you to prey on your weaknesses (like Jimmy Fallon), or might simply be negligently ignorant about those statistics (like reporters at every major news outlet).

.png)


